|
|
|
|
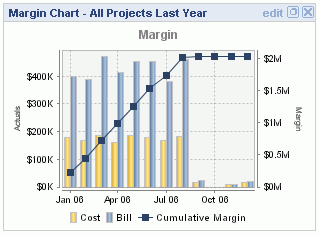
This chart can be run to provide a comparison of Billable Charges and Costs in a bar and line chart format. The chart will include two bars for each month (one for cost and one for billable charges) as well as a line representing the cumulative margin since the beginning of the chart through the end of the period that contains the data point. The margin is calculated as the difference between the billable charges and costs.
Click Through for Details
You can click on an individual bar within the chart to run an Actuals Summary report for the one period represented by the bar (either bill or cost). You can click on a data point in the cumulative line to run a People >> Margin (T&E) report for a date range defined by the beginning of the chart through the end of the period represented by the clicked data point. Both the Actuals Summary and Margin T&E reports will show one line per project/person that contributed to the metrics for the bar/line.
This report is available to users having any of the following roles: Administrator, HR Administrator, P&R Administrator, as well as Manager and Viewers that have both Cost Rate Manager and Bill Rate Manager roles.
This report is available with the Project Portfolio family of licenses.
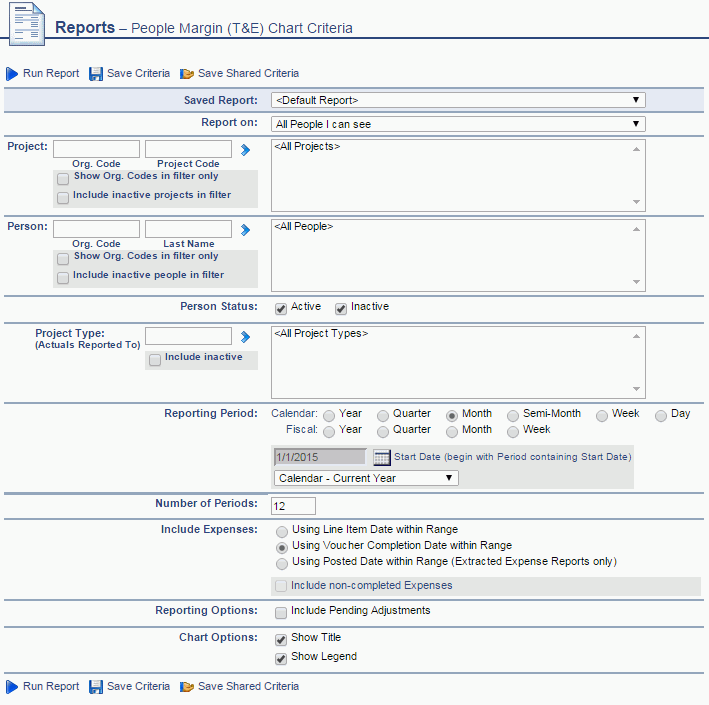
Topics covered on this help page include:
Selection Criteria (options available to tailor chart output)
You may also be interested in:
Dashboard Management (charts can be added to one of your dashboards)
|
|
![]()