|
|
|
|
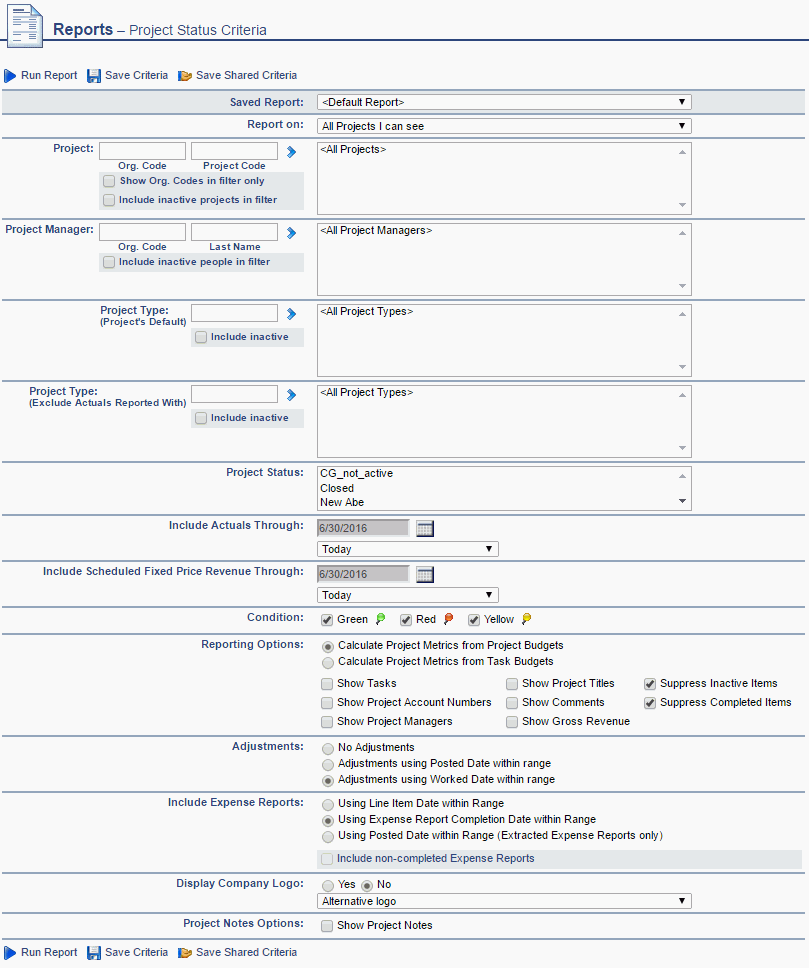
This report provides a view of project progress for each project selected. You can run this report at a summary project level or choose to include more details including Tasks, Project Manager, Account Numbers, Comments, and even Project Note details.
This report is available to users having any of the following roles: Administrator, P&R Administrator and Project Administrators.
Users having the Bill Rate Manager role will have the Bill related columns included in the output. Likewise, users having the Cost Rate Manager role will have the Cost related columns included in the output (unless the Allow Cost Reporting for Non-Cost Rate Managers (unanet.non_cost_mgr.allow_cost_reporting) property is enabled, in which case non-Cost Rate Managers will still have the Cost related columns included in the output).
This report is available with all Unanet editions.
Topics covered on this help page include:
Selection Criteria (options available to tailor report output)

Note: When checking the Show Project Notes option, an entire additional selection criteria section will appear below the standard Project Status Report selection criteria. This additional set of selection criteria is the exact same selection criteria available on the Project Notes >> Search tab.
Using this option, you can optionally include project note details within your Project Status Report output.
|
|
|

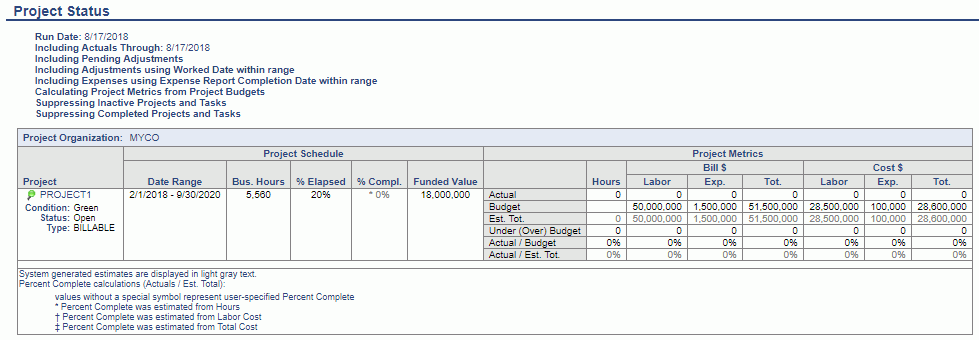
Usability Tip: On this report you can click on a Project Code which will navigate you to the project profile for that specific project. It may be useful to right click on that link and open the project's profile in a new tab. This will allow you to adjust your project / task settings and then refresh this report in the original tab to review the resulting changes.
Note that the calculation for the %Elapsed field is current date - project start date / project end date - project start date (counting calendar days, not business days). For example, using the following dates:
Project Start Date: 2/1/2018
Report Run Date: 8/17/2018
Total Days Elapsed: 197
Project Start Date: 2/1/2018
Project End Date: 9/30/2020
Total Days Available: 972
then % Elapsed: 197/972 = 20%
See the Report Calculations page for more information about how derived values are calculated.
Notes:
-- Business Hours are calculated as the number of business days within the date range times 8 hours per day.
-- There are no exceptions for holidays nor is the business week of particular users taken into account.
-- Calculating metrics from Project level vs Task level may provide different results. See Report Calculations > Project vs Task Discrepancies for additional information.